
Google Analytics
First of all, the digital analytics is a measure or a process of analysing, collecting, monitoring the data. The main purpose of Google Analytics is to track and analyse the data in real-time. Therefore, it can be used to track a website visitors with maximum details for both personal and business purposes.
Need of Google Analytics:
Before using it, we should know the purpose and why it is much necessary. It gives results for our various kind of needs. Most of the SEO specialist used to monitor Google Analytics reports keenly to look after the progress of ranking & traffic after implementing link building strategies.
- How many peoples visited to the site or blog?
- Most viewed page of your website
- Active users
- What kind of devices, sources used to visit the site ? etc.,
There are lots and lots of questions arises in our mind. Before start using it, we shall take a tour how to use Google Analytics.
STEP 1: Create an Account
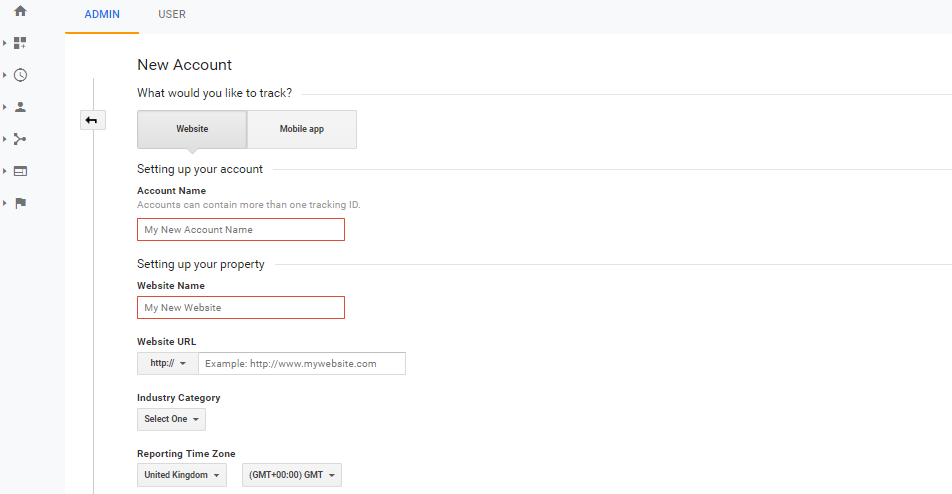
STEP 2: COPY AND PASTE THE TRACKING CODE
After successfully creating an account, you will be provided with the Tracking Code, which is to be copied and should paste in the website or blog‘s (index.html) file before </body> tag you are willing to track.
If you missed the location, go to the particular property and you can find “Tracking code” under Tracking Info. The exact location will be like Property -> Tracking Info -> Tracking Code.
If you are using any third party WordPress plugins, then you can insert the Tracking Id on the location it request. Else you want to place the “Tracking Code” on the header or footer of your website.
For example: If you are using Yoast SEO WordPress Plugin then there is an option to integrate Google Webmaster Tools.
Therefore, by using the tracking code in the website the Google Analytics will start tracking the data in real-time. Before start tracking the data, lets know some of the features of the Google Analytics.
Main Features of Google Analytics:
- Organisation, account links, search
- Diagnostics and Google accounts
- Report navigation
- Action bar
- Add segments, set the date range
- Report tabs
- Graph
- Data table
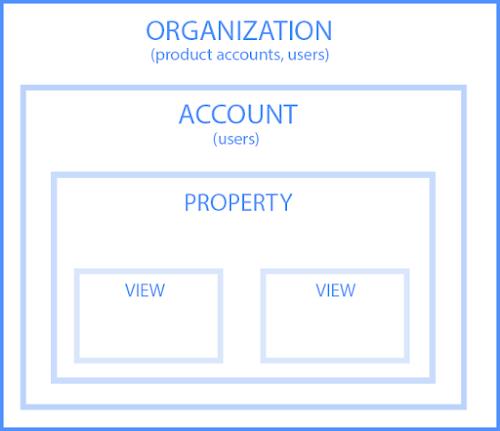
ORGANISATION, ACCOUNT LINKS, SEARCH:
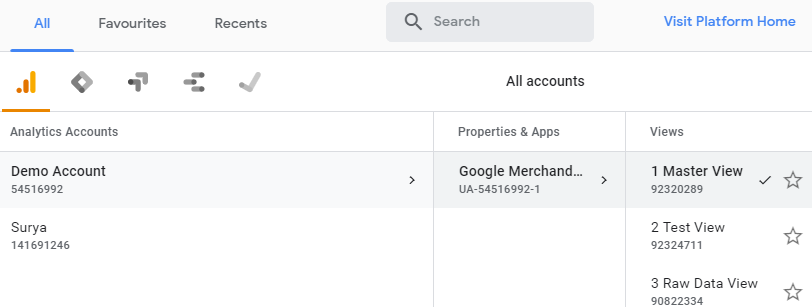
The structure looks like a Breadcrumb which includes Organisation, Accounts, Property, Views.
- Organisation: Within Google Marketing Platform, the representation of your company, and the management framework for your company’s product accounts and users.
- Product accounts: Other Google Marketing Platform product accounts like Tag Manager and Optimise.
- Account: Your access point for Analytics, and the top-most level of organisation within the product.
- Property: A website, mobile application, or device (e.g. a kiosk or point-of-sale device.) An account can contain one or more properties.
- View: Your access point for reports; a defined view of data from a property.
DIAGNOSTICS AND GOOGLE ACCOUNTS:
When you logged in into Google Analytics account there you have various options to handle the accounts & different business without any confusion.
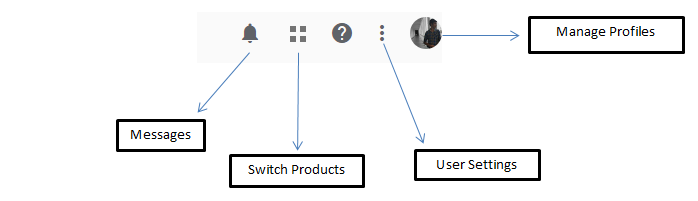
Notification/Messages – Bell Symbol will be showing the messages or recommendation that your account receive. If suppose there was an important update or any feature change else there may be any issue with your account, in that case you will receive the information through this option.
Switch Products – As we know there are various Google Product available in the market and you can switch between them easily. It gives an option for easy & smooth navigation between the google products.
User Setting – It allows you to send the feedback about the product & its usage.
Manage Profiles – If you have multiple Google Accounts for different business then you can navigate between them using this Option. Google Accounts allows switching between the accounts in a feasible manner. It is an added advantage for the business people to manage multiple client accounts separately.
REPORT NAVIGATION:
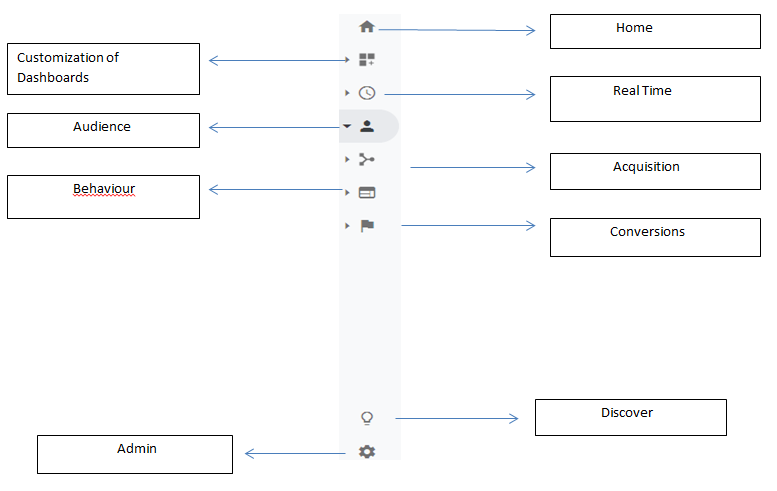
Report Navigation comprises with all the available options in Google Analytics Dashboard. To check the reports, statistics or any other data for an analysis then it should be found on the Report Navigation. The collection & representation of the data has been classified in different forms as Audience, Acquisition, Behaviour and Conversion.
ACTION BAR:
![]()
Save: To save the current configuration of the report.
Export: To export your report data for use in other applications like Excel.
Share: To share a report, even if the recipients don’t have the Google Analytics accounts
Edit: To edit the report
Insights: To see your data generated by Analytics machine learning, and query your data using natural language
ADD SEGMENTS, SET THE DATE RANGE:
A segment is a subset of your analytics data. By adding segments you can report to compare different subsets of data.
Click a segment to edit, copy, or remove it. (You can’t edit the default system segments).
REPORT TABS: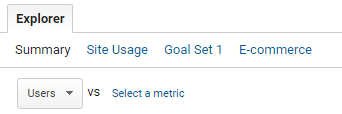
Analytics reports display data in one or more tabs, providing multiple views of the data in one place. Most standard reports include an Explorer tab, which typically has 2 parts: a graph of your data on top, and a data table below. Also some of the reports include additional tabs like Overview or Map Overlay.
GRAPH:
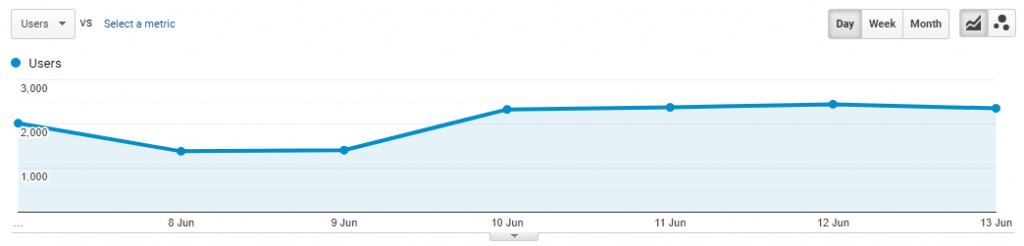
Graph Metric Selector: You can compare 2 metrics on the graph. For example, Sessions vs Bounce Rate. Located below the metric group links.
Graph Time Scale Buttons: You can choose between day, week, or month. Located to the right of the graph metric selector.
Graph Type Buttons: Used to change the graph display.
DATA TABLE:

This data table is used to display the data by sorting the options in the metrics. Near to the advanced search, you can apply filters in viewing the data.
![]() Data: It displays the data in a tabular view. This is the default table view.
Data: It displays the data in a tabular view. This is the default table view.
![]() Percentage: It displays a pie chart, showing the contribution to the total for the selected metric.
Percentage: It displays a pie chart, showing the contribution to the total for the selected metric.
![]() Performance: It displays a horizontal bar chart, showing the relative performance for the selected metric.
Performance: It displays a horizontal bar chart, showing the relative performance for the selected metric.
![]() Comparison: It displays a bar chart plotting the performance of the selected metrics relative to the site average.
Comparison: It displays a bar chart plotting the performance of the selected metrics relative to the site average.
![]() Term cloud: It displays a visual representation of the performance of keywords (not available for all reports)
Term cloud: It displays a visual representation of the performance of keywords (not available for all reports)
![]() Pivot: It rearranges the information in the table for certain reports by pivoting your data on a second dimension.
Pivot: It rearranges the information in the table for certain reports by pivoting your data on a second dimension.
HIERARCHY OF ORGANISATION, ACCOUNTS, USERS, PROPERTIES AND VIEWS:
So far, we have seen about the main features of Google Analytics. Now, let’s see how to set goals in analytics.
SET UP GOALS:
Goal help us to reach the target better. When it comes to a website/blog, your goal should be all about generating traffic and converting the visitors into customers. If it is a Business websites then your goal is to make them purchase or to submit a contact form. so using Google Analytics you can track the goal & it’s position in a strategic way.
If you know about SEO & if you are looking to optimise your website for search engines, then you should have implemented the Goals to see the progress.
Goals will tell Google Analytics when something important has happened on your website. For example, if you have a website to sell the products, a confirmation page for visitors land on once, when the purchase is completed.
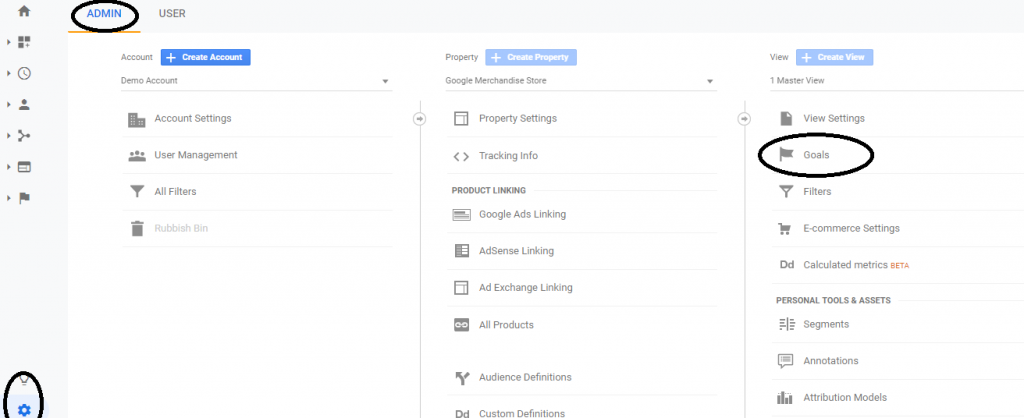
- To set goals, click on Settings -> Admin (on the top) -> Goals ( Under website view column)
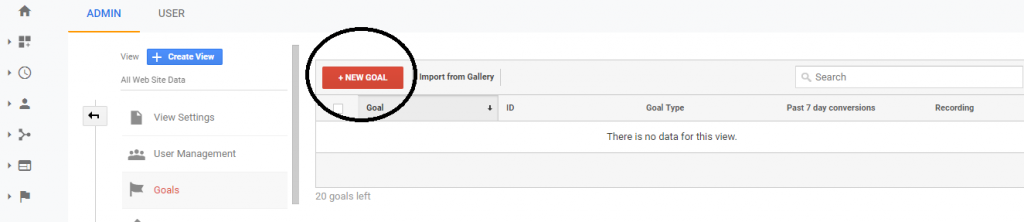
After that, click on New goal button,
-
-
- After that, select the custom option and click continue.
- Enter the name of the goal and choose destination.
- You will enter your thank you or confirmation page’s URL after the .com of your website in the Destination field and change the drop-down to “Begins with”.
- You will then toggle the value and enter a specific dollar value for that conversion (if applicable) and click Create Goal to complete the setup.
-
Similarly, you can set up to 20 goals on your website. Depending on the websites, the goals can vary.
SET UP SITE SEARCH:
The main purpose of the site search in the website is to help the visitors to search products or information which is present in the website. The site search can be tracked in the Google Analytics, if it is present in the website.
- To set up site search, go to your Google Analytics Admin menu again, and in the view column, click on view settings.
- Scroll down until you see site settings and toggle it to On.
- Look back at your URL for your search results. Enter the query parameter and click Save. For example, on your blog the query parameter is s. After that, click save.
This will allow Google Analytics to track any searches made on your website. By tracking, it helps to convert the visitors into customers.
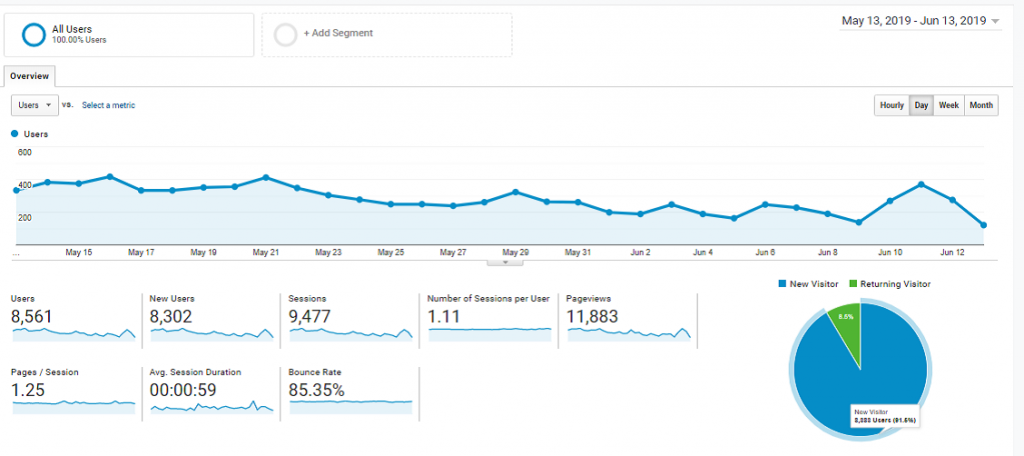
- Once the process is started, select the option ‘ Overview ‘ in the Audiences. Every time you visit the website, you will be able to track the data.
If you have multiple sites or blogs , at the top right , you can click on the drop-down arrow next to your website to switch to different websites within all of your Google Analytics accounts.
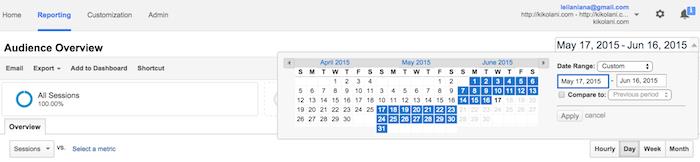
- If you want to check the report for a particular period of time, at the top right click on the date range you want to view.
To explore various analytics report, you can click on any line of the graph which shows the no. of sessions per day.
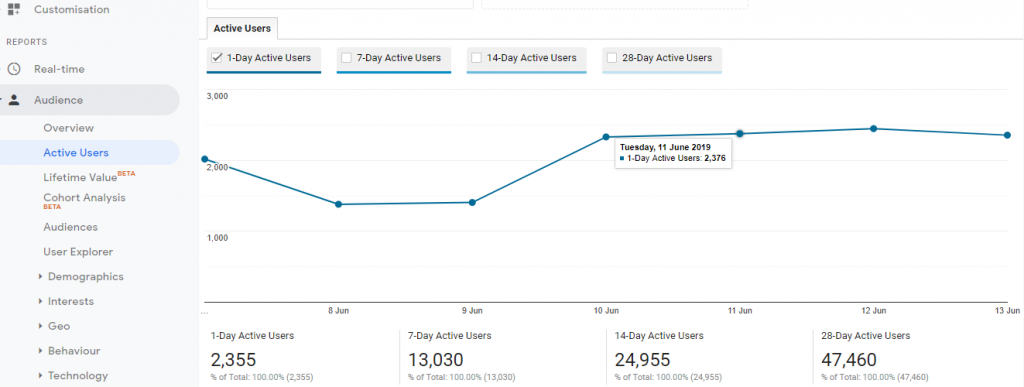
- You can also track the current status of the site by clicking on the ‘Active Users’ on the left side of the Reports Menu
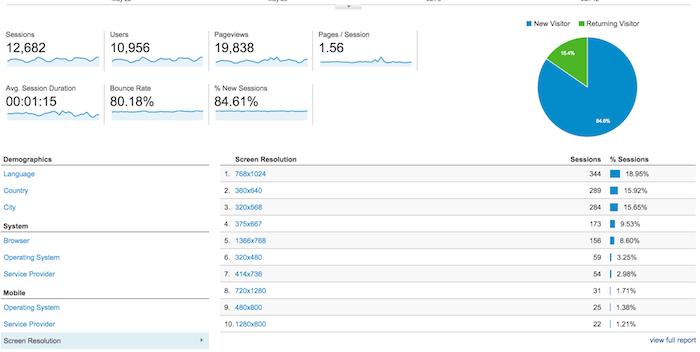
- The user can view the type of source, mediums used to visit the page and also kind of device , OS , service provider , language. It also helps to view the location of the user.
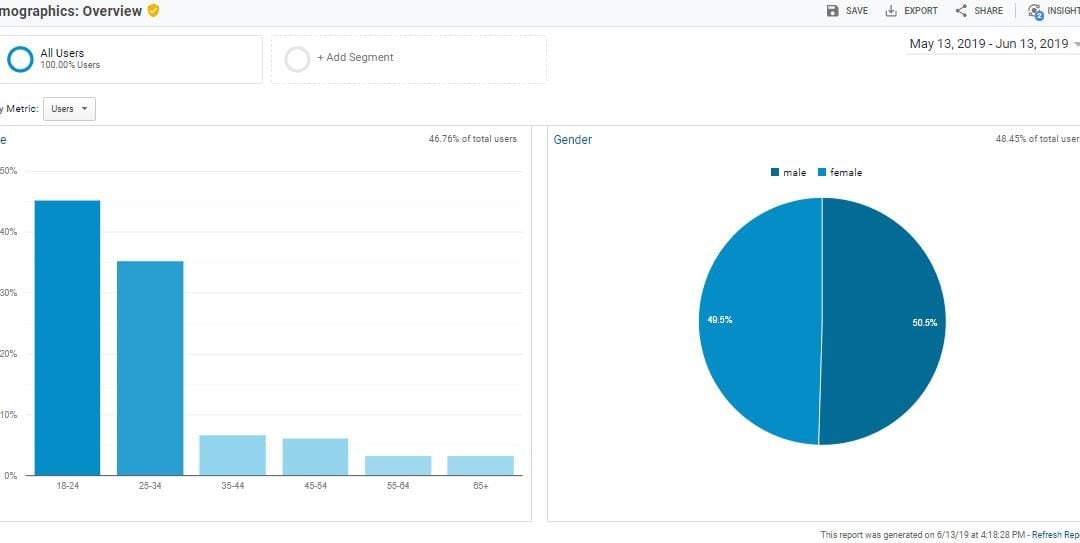
- The Google Analytics helps to focus on the particular region which makes us to analyse the data. For example , if you select India it gives more details about the particular region
- In addition, the users can analyse the types of gender who is visiting the site and also the age range. If the results generated are only from organic ranking then you can use this details to target the people through paid marketing. In facebook targeted marketing/ google display marketing, you can focus the age group/gender based on the Google Analytics report.